Q Sphere illustrates the probabilities of measuring various states along with their respective phase. Qiskit provides inbuilt function to create Q Sphere visualizations. In this chapter of the Qiskit Tutorial, you will learn about how to create Q Sphere visualization by making use of the visualization module of qiskit.
Q Sphere allows the state of multiple Qubits of a Quantum Circuit to be visualized on a single sphere. This makes Q Sphere more convenient for visualizing the state of multi-Qubit Quantum Circuits. For this reason, Q Sphere visualizations are generally preferred over Bloch Multi Vector when visualizing the results from Statevector Simulator.
Importing Q Sphere Visualization Function
The plot_state_qsphere() function of qiskit.visualization module creates a visualizations for the Qubit
from qiskit.visualization import plot_state_qsphere()Plotting Q Sphere
The plot_state_qsphere() method accepts data for plotting Q Sphere as a Statevector or a Density Matrix.
Example
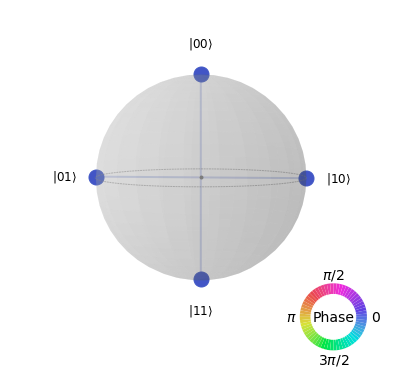
In the following example, we will plot the following statevector on the Q Sphere-
[0.5 0.5 0.5 0.5]
which represents the state: ψ = 0.5 |00> + 0.5 |01> + 0.5 |10> + 0.5 |11>
plot_state_qsphere([0.5, 0.5, 0.5, 0.5])The output of this will be-
Visualizing Statevector Simulator Results on Q Sphere
In this section, we visualize the results from the Statevector Simulator using a Q Sphere.
# Creating a Quantum Circuit to run on the Statevector Simulator
qc=QuantumCircuit(2)

# Applying H Gate to both Qubits
qc.h([0,1])

# Setting Backend to Statevector Simulator
backend = BasicAer.get_backend('statevector_simulator')

# Executing the Quantum Circuit
job=execute(qc, backend)

#Get results from job
result = job.result()

# Getting the count of various measurement states
state_vec = result.get_statevector()

# Plotting Q Sphere
plot_state_qsphere(state_vec)
The output of this will be-

Note– The get_statevector() method returns the statevector in the form of a numpy array. Therefore, state_vec variable can be passed directly to the plot_state_qsphere() function.
Parameters
The following are some of the important parameters of the plot_state_qsphere() function-
| Parameter | Brief Description |
|---|---|
state | It is a Statevector or a Density Matrix that represents the state of all Qubits in the Quantum Circuit. It is usually passed as a positional parameter. |
use_degrees | A boolean value that indicates whether to use degrees to denote phase values. Default is False. |
show_state_labels | A boolean value that indicates whether the labels for each basis state are to be shown. Default is True. |
show_state_phases | A boolean value that indicates whether the phase for each basis state is to be shown. Default is False. |
figsize | A Tuple that contains the size of the figure in inches. |