Cityscape is used for plotting the real and imaginary parts of the state matrix on three-dimensional bar graphs. These three-dimensional bar graphs are known as cityscape. Qiskit provides inbuilt function to create Cityscape visualizations. In this chapter of the Qiskit Tutorial, you will learn about how to create Cityscape visualizations by making use of the visualization module of qiskit.
Cityscape plots the state matrix on a pair of three-dimensional graphs- one for real parts, and another for imaginary parts of the state matrix. In addition to the real and imaginary parts of the state matrix, cityscape also gives information about the mixed states.
Importing Cityscape Visualization Function
The plot_state_city() function of qiskit.visualization module creates a visualizations for the Qubit
from qiskit.visualization import plot_state_city()Plotting Cityscape
The plot_state_city() method accepts data for plotting Cityscape as a Statevector or a Density Matrix.
Example
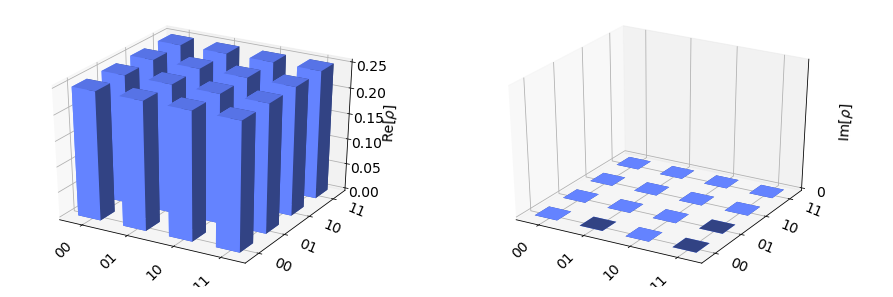
In the following example, we will plot the following statevector on the cityscape –
[0.5 0.5 0.5 0.5]
which represents the state: ψ = 0.5 |00> + 0.5 |01> + 0.5 |10> + 0.5 |11>
plot_state_city([0.5, 0.5, 0.5, 0.5])The output of this will be-

Notice the two separate cityscapes, one each for real and imaginary parts.
Visualizing Statevector Simulator Results on Cityscape
In this section, we visualize the results from the Statevector Simulator using a Cityscape.
# Creating a Quantum Circuit to run on the Statevector Simulator
qc=QuantumCircuit(2)

# Applying H Gate to both Qubits
qc.h([0,1])

# Setting Backend to Statevector Simulator
backend = BasicAer.get_backend('statevector_simulator')

# Executing the Quantum Circuit
job=execute(qc, backend)

#Get results from job
result = job.result()

# Getting the count of various measurement states
state_vec = result.get_statevector()

# Plotting Cityscape
plot_state_city(state_vec)
The output of this will be-
Note– The get_statevector() method returns the statevector in the form of a numpy array. Therefore, state_vec variable can be passed directly to the plot_state_city() function.
Parameters
The following are some of the important parameters of the plot_state_city() function-
| Parameter | Brief Description |
|---|---|
state | It is a Statevector or a Density Matrix that represents the state of all Qubits in the Quantum Circuit. It is usually passed as a positional parameter. |
title | It is a string that is used for the plot title. |
color | A list of two strings that contains the color for real and imaginary plots of cityscape. |
alpha | A float between 0 and 1 that indicates the transparency value of bars. Default is 1. |
figsize | A Tuple that contains the size of the figure in inches. |