Bloch Sphere is a convenient way to represent the state of Qubit. Each point on the Bloch Sphere corresponds to a state that a Qubit can possibly be in. Qiskit provides inbuilt function to represent the state of a Qubit as a Bloch Vector visualization. In this chapter of the Qiskit Tutorial, you will learn about how to create Bloch Vector visualization by making use of the visualization module of qiskit.
Importing Bloch Vector Visualization Function
The plot_bloch_vector() function of qiskit.visualization module creates a visualization on the Bloch Sphere for the given Bloch Vector.
from qiskit.visualization import plot_bloch_vector()Plotting Bloch Sphere
The plot_bloch_vector() method accepts the coordinates of the Bloch Vector and plots the Bloch Vector on the Bloch Sphere.
x– The x coordinate.y– The y coordinate.z– The z coordinate.
Example
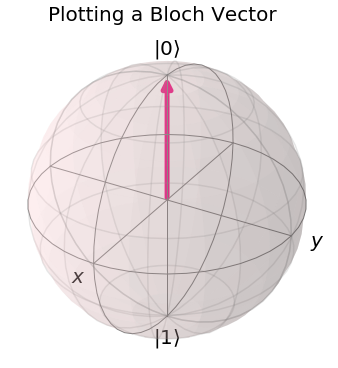
In the following example, we plot a bloch vector with the given coordinates- x = 0, y = 0, z = 1. These coordinates correspond to the state |0>.
plot_bloch_vector([0, 0, 1],title='Plotting a Bloch Vector')
Plotting Bloch Sphere with Spherical Coordinates
It is also possible to plot the Bloch Vector with spherical coordinates in place of cartesian coordinates.
The spherical coordinates need to be passed as a list to the plot_bloch_vector() function in the following order
r– The distance from the centre of the Bloch Sphere.theta– The angle made by Bloch Vector with positive Z-axis(in radians).phi– The made by Bloch Vector with positive X-axis(in radians).
Additionally, the value of coord_type parameter needs to be passed as 'spherical'
Note– In case of pure(non-entangled) states, the value of r will always be 1. However, in case of mixed(entangled) states, the value of r can be less than 1.
Example
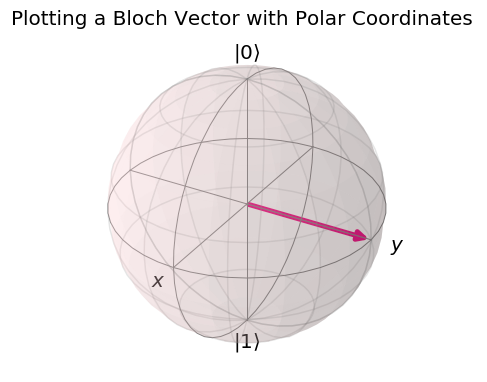
In the following example, we plot a Bloch Vector with the following parameters- r = 1, theta = π/2, and phi = π/2. These spherical coordinates correspond to the state |i>
plot_bloch_vector([1, np.pi/2, np.pi/2],
coord_type='spherical',
title='Plotting a Bloch Vector with Polar Coordinates')
Parameters
The following are the parameters of the plot_bloch_vector() function-
| Parameter | Brief Description |
|---|---|
bloch | It is a list of float containing 3 elements. The elements can correspond to the x, y, and z coordinates or r, theta, and phi. It is usually passed as a positional parameter. |
title | It is a string that is used for the plot title. |
coord_type | It is a string that specifies the coordinate type for Bloch Vector- Cartesian or Sphereical. The value of this parameter should be either 'cartesian' or 'spherical'. Default is 'cartesian'. |
figsize | A Tuple that contains the size of the figure in inches. |